





I employ a more aggressive approach to cash poker games early in the session. Trust me, I know. The optimal strategy is to play tight, gain information and pounce when you can. But my starting chip stack gives the allure of lower stakes. Let’s see a few (extra) hands! Ten-eight suited is good, right?
That’s where the trouble starts.
Advertisement
The idea that the situation carries less value, so our play should be looser, adds risk. Think about Rounds 5-8 in fantasy drafts. No, we’re not talking about the elite options. But the impact of a bust can make all the difference in a playoff run or the sudden desire to focus on next year’s draft class. As such, let’s dive into this area of the draft and find the players worth avoiding in 2026.
Join or create a Yahoo Fantasy Football league for the 2026 NFL season
Trust Adjust the Process
In Rounds 1-4, we calculated bust rates as a sliding scale and isolated the failure mechanisms, which brought us to the profiles we could use to identify this year’s candidates. We’ll do the same thing here. But we need to make a slight adjustment. I’ll use my own decision (read: mistake) as an example.
Darnell Mooney was one of my highest-drafted players last year. He showed flashes of WR1 talent in Chicago, and Michel Penix Jr. was known for heaving the ball downfield. As a pure complement to Drake London, Mooney was the perfect fit.
Advertisement
But a training camp injury that lingered into the regular season derailed all my plans. Even worse, because I looked at Mooney as my WR3/FLEX (i.e., not an every-week starter), I held onto him. He even made a starting lineup or two despite reality not jibing with preseason expectations. And like my poker analogy, I found myself falling behind the competition.
-
Rounds 1-4: 40.6% (Overall Bust Rate)
A similar (or worse!) chance of a player falling short of their ADP still exists outside of the first few rounds. Again, even though the names don’t spark as much excitement, we still need their production. However, like my Mooney story, we know CeeDee Lamb and Jayden Reed are in two (very) different tiers. Accordingly, how we view busts should also be different.
Here’s a look at WR bust rate from positional ADP tiers. (Photo by Chris Allen/Yahoo Sports)
(Chris Allen)
As I mentioned, I tried to apply the same scaling-tier method to calculate bust rates. But notice the change in behavior outside of the top 24. Instead of crests and dips highlighting the shifts in opportunity cost early, we see a flattening across the ranks.
Advertisement
Intuitively, this makes sense. Drafting DJ Moore or Jameson Williams this year is more about preference. But if you’ve got the 1.03, you’re taking Ja’Marr Chase, not Justin Jefferson. Yet, this doesn’t mean we should apply a flat approach across the entire sample.
The result is about what you’d expect. By ignoring the power of early picks, more players who disappointed look worthy of the ADP, while later clicks take the brunt of the stringent threshold. However, since we can agree the pick price falls in R5-8, a flat-tier approach should be viable.

Here’s a look at scaled system vs. a flat top-36 tier. (Photo by Chris Allen/Yahoo Sports)
(Chris Allen)
All I wanted from Mooney was a WR3 or FLEX option that I could rotate onto my roster. And, depending on your team-building strategy, you’ll be asking the same of your R5-8 picks. A single boundary (top 36 used here) answers the question. Plus, the variation between buckets indicates we’re capturing what we need from the results. With the process nailed down, let’s move on to the profiles.
Advertisement
The Essence of Failure
Whew, that subheading is dark.
Anyway, with a better idea of how to calculate bust rates, I broke down how it changes per round for both RBs and WRs.

Here’s a look at bust rate in Rounds 5-8. (Photo by Chris Allen/Yahoo Sports)
(Chris Allen)
I know what you’re thinking. Receivers become a hazard after the sixth round. It’s more likely we find failure than avoid it. But remember our line in the sand.

Here’s a look at startability for WRs by round. (Photo by Chris Allen/Yahoo Sports)
(Chris Allen)
The top 36 threshold was to help us find WR3/FLEX options. Essentially, they’re guys we could put on our starting roster. And while we see the bust rate climbing, the implication isn’t that these receivers could never earn a starting spot. It was just less often.
Advertisement
Since 2021, a WR with an R5 ADP has cleared the top 36 a little over eight weeks of the fantasy season. That’s just about half the year. Of course, that average declines as a function of ADP. We lose two games by the time we get to the eighth. That’s why the later rounds are still important, since we’ll need as many swings at mid-tier replacements as possible. In either case, with the “how many” question answered, let’s dig into the “why.”

Looking at the factors that led to wide receivers busting in this draft range.
(Chris Allen)
Just like their early-round counterparts, the WRs and RBs in R5-8 are no stranger to long-term absences. Between the two roster designations, gamers had to suffer an average of 6.0 games missed. But that’s not something we can usually predict.
Less than half carried notes from the preseason indicating similar ailments. Like Christian Watson’s nagging hamstring injuries that, well, hamstrung his ’23 results. So, with this being the heart of draft season, check the latest news to see if you need to adjust the ranks. But it’s the healthy cases that will give us the most information to take forward into ’26.

Looking at the factors that led to a clean-production bust by position.
(Chris Allen)
No surprise, but the receiver position has a few factors to consider. While we have multiple metrics that can tell us the player has talent, their surroundings can (and will) impact their output all the same. Just ask Michael Pittman Jr. after switching from Daniel Jones to Riley Leonard to Philip Rivers last year. Those scenarios are harder to project, which makes avoiding busts a more difficult task.
Advertisement
RB busts are a bit easier to see ahead of time, though. Added competition being the problem in over half of the historical sample isn’t to say every addition should be a concern (I’m looking at you, Blake Corum truthers). But they’re signs of fragility in a rusher’s projectable workload. And if we can look at the new guy’s skill set and see more overlap than complement in his abilities, we should be on high alert.
Now, with all this in mind, let’s see who stands out in Rounds 5-8 for 2026.

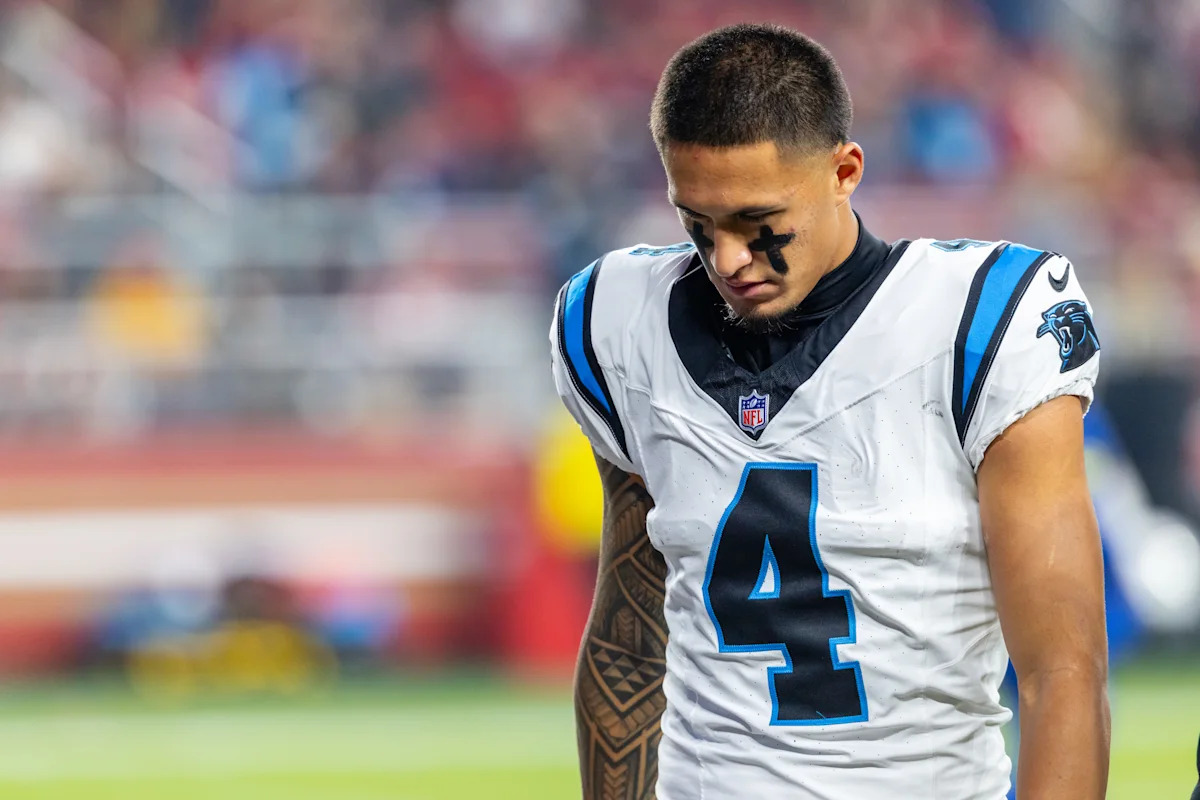
Round 5 – Tetairoa McMillan, WR, Panthers
We witnessed the embodiment of “Any given Sunday” in late November last year.
Tetairoa McMillan finding gaps in coverage for a long gain wasn’t as much of a shock. He’d been doing it most of the season. As most expected, the Arizona product was letting us know why draft analysts considered him to be one of the premier prospects of his class.
Advertisement
-
Air Yard Share: 43.0%, 2nd (among all WRs, min. 400 routes)
-
Target Share: 26.0%, 10th
The only other rookie who came close to McMillan was Emeka Egbuka with a 37% air yard share. Otherwise, by fantasy standards, the ’25 crop of receivers started and ended with the Panthers’ WR1. And his talent translating to the pro level was what we wanted to see. His situation is the big question mark.
-
EPA per Dropback (Rank among all starting QBs): 31st (2023), 17th (2024*), 27th (2025)
-
Passing Success Rate: 32nd, 26th, 23rd
-
Completion Percentage Over Expected: 24th, 14th, 19th
Bryce Young’s career has been, well, something. HC Dave Canales wound up benching Young in early 2024, and it took an Andy Dalton car crash for the sophomore passer to see the field again. And he looked better! But last year was more of the same. Meanwhile, despite the impressive number of looks McMillan earned, his on-field deployment did him no favors.
-
Slot Snap Rate: 15.2%, 19th (of 24 qualifiers – min 20.0% target share)
-
Slot Target Rate: 22.7%, 14th
-
Pre-Snap Motion Rate: 3.4%, 21st
Canales opted not to pull on any of the levers at his disposal to free up his WR1. In some respect, he didn’t need them. But to keep the offense on schedule, a few easy buttons for his volatile QB would help matters. It’s why analysts have been quick to point out McMillan’s pre-snap alignment during preseason. However, without more information to support a shift, we’re only hoping the second-year WR will see more high-percentage targets.
Round 6 – David Montgomery, RB, Texans
Let’s first remember the good old days for David Montgomery.
I’m sure gamers who are bullish on a Montgomery bounce-back will look to his new lead-back status as proof. However, even having to split time with Jahmyr Gibbs as part of a high-powered offense had its perks.
Advertisement
-
Red-zone Plays per Game: 11.2 (Detroit – 2025), 9.8 (Houston – 2025)
-
Red-zone Conversion Rate: 68.8%, 49.3%
-
Offensive Points per Game: 27.8, 22.4
The Lions operated more in their opponent’s red zone and were better at executing plays in that area of the field. That type of environment would attract any drafter. And if you zoom in a bit more, the appeal only strengthens.
-
EPA per Dropback: 0.17 (Goff), 0.07 (Stroud)
-
Passing Success Rate: 48.0%, 44.7%
Jared Goff, without Ben Johnson, still performed better than C.J. Stroud. And before you say “offensive line,” check their pressure rates. Both were under duress on 36-37% of their dropbacks. At least Houston made strides to improve Stroud’s protection. But the loss of Jayden Higgins puts more strain on the passing game. And then there’s the potential for a tighter split within the Texans’ backfield than we thought during the summer.
Despite becoming the starter in Week 10, Woody Marks ranked below the league-average starter in forced missed tackle rate (12.8%), adj. yards after contact per carry (2.9), and rushing success rate (44.4%) on early downs. But he’s shown improvement over the summer with an eye on keeping the third-down, pass-catching job. If we’re looking at a 1A/1B scenario on a stagnant offense, I’d rather look elsewhere on the board.
Advertisement
Round 7 – Bhayshul Tuten, RB, Jaguars
Honestly, I’m not pointing out Bhayshul Tuten out of hate. If anything, I was ready to pay the iron price for him as soon as Travis Etienne Jr. left Jacksonville.
Even on limited snaps, you could see HC Liam Coen’s vision for Tuten as a starter. He could power through the middle of a run-stopping unit or sidestep a defender for big gains as a receiver. But let’s put some of his production into context.
His game against my Bengals’ defense is doing some heavy lifting. Just over 40% of his receiving yards for the entire season came on that day. His YPRR and YAC per reception get cut in half without it. There’s a reason why he only earned 14 targets the entire year. And Etienne’s presence (52) had little to do with the situation. And, to make matters worse, the Jaguars brought in another guy who can do what Tuten does best.
Advertisement
-
(Early-Down) Rushing Success Rate: 51.8% (Tuten), 50.0% (Rodriguez)
-
Adj. Yards after contact per att.: 3.2, 3.7
-
Forced missed tackle rate: 21.7%, 20.5%
Chris Rodriguez Jr. reunites with his college OC after a noteworthy end to his time with the Commanders. After Austin Ekeler’s injury, Rodriguez took on 34% of the team’s carries and 45% of the team’s goal-line attempts. Jayden Daniels missing multiple weeks kept us from seeing Rodriguez in an ideal situation, but now in Jacksonville, he poses a threat to Tuten’s share of the backfield.
Round 8 – Carnell Tate, WR, Titans
My concerns for Carnell Tate summed up in a single tweet:
Cam Ward has thrown 24 passes during the preseason. The breakdown is our first red flag.
-
Wan’Dale Robinson: 26.1% (Target Rate), 14.5% (Air Yard Share)
-
Carnell Tate: 21.7%, 43.5%
-
Tyjae Spears: 17.4%, -4.3%
-
Elic Ayomanor: 13.0%, 25.4%
Remember, Calvin Ridley didn’t play, Chimere Dike rotated in with the second team and Gunnar Helm only ran seven routes. And while both OC Brian Daboll and Ward want to get their first-round receiver involved, Tate is yet to record a catch. He went 0-for-4 in August. Unfortunately for him, that speaks to the passing situations he finds himself in with the Titans.
Advertisement
-
EPA per Dropback: -0.16, 32nd
-
Passing Success Rate: 37.7%, 32nd
I’ll admit Ward looked better down the 2025 stretch (against weaker defenses). But he’s learning a new scheme focused on taking what the defense allows. And they’re less likely to allow 22.5 air yards per target (Tate’s average during the preseason). With other short-area options available, Tate has added competition, which will impede a breakout in his rookie year.
Read the full article here