




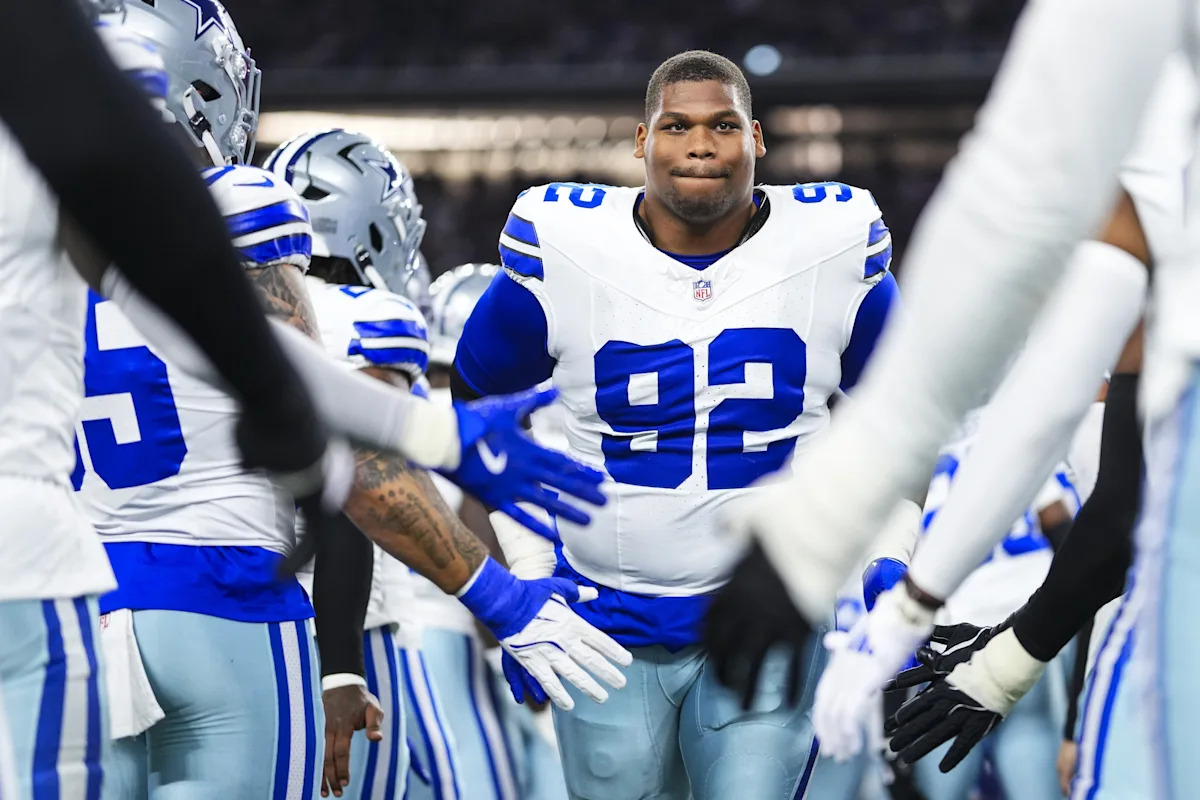
The Cowboys’ pass rush was better than its 35 sacks suggest. In fact, when measuring total pressures rather than sacks, Dallas’ front seven ranked sixth in the NFL in 2025.
Surprised? Read on.
It used to be that the key to slowing down modern offenses was to get pressure on the passer. The assumption was that if the quarterback is pressured or hurried, it’s much more likely he’ll make a mistake and turn the ball over or make enough bad passes to get off the field.
Advertisement
Of course, pressuring the passer only works if your secondary is any good. And the 2025 Cowboys secondary was the exact opposite of whatever “good” is.
In the NFL, pressure has traditionally been measured by sacks. And at first glance, the 2025 Cowboys pass rush wasn’t very good, ranking only T22nd with 35 sacks.
But considering that NFL QBs last year only held the ball between 2.2 – 2.5 seconds on average, just penetrating the pocket and pressuring the QB to throw early must be considered a success for the defense.
So to get a true feel for the effectiveness of the pass rush, you’ve got to measure a defense’s ability to pressure the quarterback, either in form of sacks, hits, or hurries.
Advertisement
And that’s exactly what we’re going to do today. We’re first going to look at the total pressures generated by the interior D-line, then the pressure generated by the edge rushers, and then try to figure out what both of it means for 2026.
In addition to sacks, the folks at Pro Football Focus (PFF) also keep track of QB hits and QB hurries. By their definition, a hit is when a QB is knocked down but not sacked, a hurry is when a QB is forced to move in the pocket in some other way than simply stepping up in the pocket to throw.
Add up all three and divide the sum by the total pass rushing snaps and you get a number which we’ll call pressure percentage. Across the NFL last year, interior defenders averaged a pressure percentage of 7.8%, while edge defenders averaged a 11.8% pressure percentage.
Interior Defenders
On paper, the Cowboys got a big boost when they added Quinnen Williams in the middle of the season last year, But did his addition actually lead to improved numbers for the D-line? Boy, did it ever! The chart below splits the DT performance into a pre-Williams and post-Williams phase and shows the pass rush snaps (PRSH), the total pressures (PRSS) and the pressure percentage (PRSS%) for each player.
Advertisement
body .sbnu-legacy-content-table td, body .sbnu-legacy-content-table th, body .sbnu-legacy-content-table { border: 1px solid #000 !important; border-collapse: collapse !important; } body .sbnu-legacy-content-table td, body .sbnu-legacy-content-table th { padding: 0px 6px !important; }
|
2025 Cowboys DI pressures |
|||||||||||||||
|
Player |
Pre-Williams (Weeks 1-9) |
|
Post-Williams (Weeks 11-18) |
|
Total |
||||||||||
|
|
PRSH |
SK |
HIT |
HUR |
PRSS |
PRSS% |
|
PRSH |
SK |
HIT |
HUR |
PRSS |
PRSS% |
|
PRSS% |
|
Kenny Clark |
251 |
3 |
2 |
22 |
27 |
10.8% |
|
211 |
1 |
4 |
12 |
17 |
8.1% |
|
9.5% |
|
Osa Odighizuwa |
224 |
1 |
9 |
15 |
25 |
11.1% |
|
196 |
2 |
11 |
14 |
27 |
13.8% |
|
12.4% |
|
Solomon Thomas |
157 |
0 |
2 |
7 |
9 |
5.7% |
|
76 |
0 |
1 |
2 |
3 |
3.9% |
|
5.2% |
|
Quinnen Williams |
|
|
|
|
|
|
|
195 |
2 |
7 |
23 |
32 |
16.4% |
|
16.4% |
|
Jay Toia |
33 |
0 |
1 |
0 |
1 |
3.0% |
|
11 |
0 |
0 |
0 |
0 |
0.0% |
|
2.3% |
|
Perrion Winfrey |
|
|
|
|
|
|
|
16 |
0 |
0 |
2 |
2 |
12.5% |
|
12.5% |
|
Total |
667 |
4 |
14 |
44 |
62 |
9.3% |
|
705 |
5 |
23 |
53 |
81 |
11.5% |
|
10.4% |
Williams wasn’t just an upgrade at DT, he was immediately the best defensive tackle. Not only did he elevate the whole unit from a pressure percentage of 9.3% to 11.5%, he was immediately the best player of the unit with a 16.4% pressure percentage.
And here’s the part where it gets really interesting: the Cowboys defensive tackles ranked No. 1 in pressure percentage in the NFL last year.
body .sbnu-legacy-content-table td, body .sbnu-legacy-content-table th, body .sbnu-legacy-content-table { border: 1px solid #000 !important; border-collapse: collapse !important; } body .sbnu-legacy-content-table td, body .sbnu-legacy-content-table th { padding: 0px 6px !important; }
|
2025 team ranking by DI pressure percentage |
|||||||||||||||
|
Rank |
Team |
PRSH |
PRSS |
PRSS% |
|||||||||||
|
1 |
DAL |
1,370 |
143 |
10.4% |
|||||||||||
|
2 |
DEN |
1,670 |
168 |
10.1% |
|||||||||||
|
3 |
LA |
1,511 |
150 |
9.9% |
|||||||||||
|
4 |
TEN |
1,130 |
112 |
9.9% |
|||||||||||
|
5 |
NE |
1,346 |
132 |
9.8% |
|||||||||||
|
6 |
SEA |
1,451 |
139 |
9.6% |
|||||||||||
|
7 |
PHI |
1,430 |
130 |
9.1% |
|||||||||||
|
8 |
KC |
1,007 |
89 |
8.8% |
|||||||||||
|
9 |
MIN |
1,348 |
118 |
8.8% |
|||||||||||
|
10 |
TB |
1,530 |
133 |
8.7% |
|||||||||||
|
|
… |
|
|
|
|||||||||||
|
15 |
NFL Avg. |
41,730 |
3,260 |
7.8% |
|||||||||||
|
|
… |
|
|
|
|||||||||||
|
32 |
SF |
1,041 |
51 |
4.9% |
|||||||||||
Without Williams, and with a 9.3 pressure percentage, the Cowboys DI was already a top 10 unit. But with Williams, the unit finished as the No. 1 unit in the league for the entire season, even topping out at an average pressure percentage of 11.5% in the second half of the season.
Advertisement
But it’s not all about Williams. If you look at Osa Odighizuwa’s numbers, and the 49ers’ ranking in the table above, it becomes clear why that trade happened – but you’ve got to wonder whether the Cowboys were fleeced in a trade that gave them a third-round pick for one of the top DI players in the league.
body .sbnu-legacy-content-table td, body .sbnu-legacy-content-table th, body .sbnu-legacy-content-table { border: 1px solid #000 !important; border-collapse: collapse !important; } body .sbnu-legacy-content-table td, body .sbnu-legacy-content-table th { padding: 0px 6px !important; }
|
TOP 10 DI players 2025 (min 150 PRSH) |
|||||||||||||||
|
Rank |
Player |
Team |
PRSH |
PRSS |
PRSS% |
||||||||||
|
1 |
Quinnen Williams (DAL) |
DAL |
195 |
32 |
16.4% |
||||||||||
|
2 |
Jeffery Simmons |
TEN |
465 |
64 |
13.8% |
||||||||||
|
3 |
Zach Allen |
DEN |
555 |
73 |
13.2% |
||||||||||
|
4 |
Chris Jones |
KC |
494 |
63 |
12.8% |
||||||||||
|
5 |
Osa Odighizuwa |
DAL |
420 |
52 |
12.4% |
||||||||||
|
6 |
Milton Williams |
NE |
293 |
36 |
12.3% |
||||||||||
|
7 |
Jowon Briggs |
NYJ |
320 |
38 |
11.9% |
||||||||||
|
8 |
Jer’Zhan Newton |
WAS |
228 |
27 |
11.8% |
||||||||||
|
9 |
Christian Barmore |
NE |
428 |
50 |
11.7% |
||||||||||
|
10 |
Kobie Turner |
LAR |
477 |
55 |
11.5% |
||||||||||
|
… |
|
|
|
|
|
||||||||||
|
32 |
Kenny Clark |
DAL |
462 |
44 |
9.5% |
||||||||||
|
40 |
Quinnen Williams (NYJ) |
NYJ |
215 |
19 |
8.8% |
||||||||||
|
99 |
Solomon Thomas |
DAL |
233 |
12 |
5.2% |
||||||||||
The table above also raises another question: who is going to replace the 64 pressures Odighizuwa and Solomon Thomas combined for last year?
Williams will obviously take up part of the slack, but that’s only if he maintains last year’s pace in Dallas. If he regresses to his Jets pace, that gap becomes even bigger, and Kenny Clark is likely maxed out already. The Cowboys added two additional DTs in free agency, but their strength might not be about creating pressure, at least not if you’re going by last year.
Advertisement
The last piece in the puzzle is rookie LT Overton, but the fourth-round pick may be more of a project than a contributor for the next one or two years.
Perhaps scheme is the answer, perhaps more production from the edge rushers is the answer, but the hole that Odighizuwa leaves won’t be easy to fill.
Edge Rushers
We saw that the interior defenders sit at the top of the league with their 10.4 pressure percentage. Might the edge defenders also be better than they are widely perceived? The NFL average pressure percentage is 11.8%, here’s how the Cowboys compare.
body .sbnu-legacy-content-table td, body .sbnu-legacy-content-table th, body .sbnu-legacy-content-table { border: 1px solid #000 !important; border-collapse: collapse !important; } body .sbnu-legacy-content-table td, body .sbnu-legacy-content-table th { padding: 0px 6px !important; }
|
2025 Cowboys Edge Rusher pressures |
|||||||||||||||
|
Player |
PRSH |
SK |
HIT |
HUR |
PRSS |
PRSS% |
|||||||||
|
Donovan Ezeiruaku |
343 |
2 |
12 |
22 |
36 |
10.5% |
|||||||||
|
Sam Williams |
270 |
1 |
3 |
20 |
24 |
8.9% |
|||||||||
|
Dante Fowler Jr. |
248 |
3 |
7 |
20 |
30 |
12.1% |
|||||||||
|
Jadeveon Clowney |
227 |
9 |
2 |
29 |
40 |
17.6% |
|||||||||
|
James Houston |
182 |
6 |
10 |
9 |
25 |
13.7% |
|||||||||
|
Grand Total |
1,348 |
22 |
34 |
103 |
159 |
11.8% |
|||||||||
Well, the edge rushers are not quite at the same level as the interior guys in terms of where they rank in the NFL. Their 11.8 pressure percentage ranks them 17th overall, which may come as a surprise anyway, given the relatively low sack total for the team overall.
Advertisement
But the edge rushers, surprisingly, may be better positioned when it comes to 2026 than the defensive tackles. Jadeveon Clowney and Dante Fowler leave a sizeable hole in the edge rusher room, but their number of pass rush snaps (475) are not that high. The Cowboys will likely continue playing with a rotation at edge rusher, and these are the guys they’ve brought in to replace that volume, along with each player’s 2025 stats:
body .sbnu-legacy-content-table td, body .sbnu-legacy-content-table th, body .sbnu-legacy-content-table { border: 1px solid #000 !important; border-collapse: collapse !important; } body .sbnu-legacy-content-table td, body .sbnu-legacy-content-table th { padding: 0px 6px !important; }
|
New 2026 Cowboys players and their 2025 pressure stats |
|||||||||||||||
|
Player |
PRSH |
SK |
HIT |
HUR |
PRSS |
PRSS% |
|||||||||
|
Rashan Gary |
415 |
7 |
12 |
35 |
54 |
13.0% |
|||||||||
|
Charles Snowden |
52 |
3 |
1 |
7 |
11 |
21.2% |
|||||||||
|
Tyrus Wheat |
47 |
2 |
1 |
0 |
3 |
6.4% |
|||||||||
|
Malachi Lawrence |
— |
— |
— |
— |
— |
— |
|||||||||
Rashan Gary may be able to close most of the pressure gap that Fowler and Clowney leave – perhaps outside of the raw sack numbers. Plus he’ll get help from first-round pick Malachi Lawrence, second-year player Donovan Ezeiruaku, and an intriguing prospect in Charles Snowden.
There’s been some discussion about Gary dropping off in the second half in Green Bay last year, and while that is definitely true for his raw sack numbers, his pressure percentage increased in the second half of the season.
Advertisement
-
Gary (Week 1-9): 238 pass rush opportunities, 29 pressures, 12.2 PRSS%
-
Gary (Week 10-WC): 208 pass rush opportunities, 31 pressures, 14.9 PRSS%
Outlook
The overall picture is more nuanced than the Cowboys’ 35 sacks suggest.
On the interior, Dallas fielded the NFL’s most disruptive group after the arrival of Quinnen Williams. Losing Osa Odighizuwa creates a significant hole, and there are real questions about how the DT room can replace that volume. The Cowboys may need DC Christian Parker to manufacture some of that production through scheme rather than individual talent.
The edge room tells a different story. While Jadeveon Clowney and Dante Fowler Jr. departed, Rashan Gary arrives with a proven track record of generating pressure at an above-average rate, Donovan Ezeiruaku should take a step forward in Year 2, and first-round pick Malachi Lawrence adds another high-upside rusher to the rotation.
Advertisement
Combined, the front seven ranked sixth overall last year in terms of pressure percentage. Not quite at the level of the league-leading Eagles, but close enough to some of the other premier pass-rush units.
body .sbnu-legacy-content-table td, body .sbnu-legacy-content-table th, body .sbnu-legacy-content-table { border: 1px solid #000 !important; border-collapse: collapse !important; } body .sbnu-legacy-content-table td, body .sbnu-legacy-content-table th { padding: 0px 6px !important; }
|
2025 front seven ranking by pressure percentage |
|||||||||||||||
|
Rank |
Team |
PRSH |
PRSS |
PRSS% |
|||||||||||
|
1 |
PHI |
2,797 |
343 |
12.3% |
|||||||||||
|
2 |
LA |
2,730 |
333 |
12.2% |
|||||||||||
|
3 |
DEN |
2,960 |
351 |
11.9% |
|||||||||||
|
4 |
HST |
2,815 |
326 |
11.6% |
|||||||||||
|
5 |
SEA |
2,830 |
318 |
11.2% |
|||||||||||
|
6 |
DAL |
2,718 |
302 |
11.1% |
|||||||||||
|
… |
|
|
|
||||||||||||
|
16 |
NFL Avg. |
82,184 |
8042 |
9.8% |
|||||||||||
The gap between Dallas and the league-leading Eagles (12.3% vs. 11.1%) is meaningful, but much smaller than the perception created by the sack totals. In other words, Dallas belonged much closer to the league’s elite pass-rushing units than to the middle of the pack.
Will the Cowboys produce more sacks in 2026? Maybe. Maybe not.
Advertisement
But if these numbers tell us anything, it’s that sacks alone don’t tell the whole story.
Pressure is a better measure of pass-rush quality and a far more stable metric from year to year than sacks, and by that measure the Cowboys were much closer to having an elite front than many people realize. The Cowboys have shown they can generate pressure. Whether that turns into a top defense in 2026 may depend less on getting to the quarterback than on what happens after the ball leaves his hand.
Read the full article here


