


Introducing NASCAR Insights.
Each week after every Cup Series race, NASCAR.com — with assistance from our partners at Racing Insights — will bring you metrics that matter, going beyond the official race results with analytics and stats. The extra information and data help to provide context to each weekend’s action, showing who is overachieving and maximizing their results and who may have areas for improvement in certain categories.
RELATED: Cup Series standings
NASCAR Insights data will be used to provide another layer of depth to NASCAR.com’s coverage, which includes projected results for each week’s race from Racing Insights, in addition to facts and figures — analyzing multiple data points throughout each lap — that can be used to zero in on performance trends and analysis for every driver in the field.
The four main NASCAR Insights metrics, including their subcategories:
Passer Rating
Passer Rating measures a driver’s efficiency in overtaking, tracking every passing opportunity throughout the race (excludes restart laps). Additionally, this statistic includes:
• Completion Efficiency: How quickly a driver is able to complete an overtake once within passing range.
• Time in Range: Amount of time a driver is in an overtaking zone without being able to complete a pass.
• Position: Running position of passes.
• Total Passes: Overall count of successful true passes during the race.
• Lapped Traffic: How well the driver manages passing lapped cars.
Defense Rating
Evaluates a driver’s ability to hold their position when under pressure, assessing their effectiveness in fending off faster cars (excludes restart laps).
• Defensive Effectiveness: How successful a driver is at preventing opponents from overtaking when they are within range to pass.
• Pressure Duration: How long the driver spends being under threat of being passed.
• Position: Running position where defending is taking place.
• Passing Time: Time it takes for the pursuing car to complete the pass, if they eventually do.
• Relative Speed: Speed of a driver‘s car relative to the field when holding onto position.
Speed Rating
Analyzes a driver’s overall pace relative to the field, tracking lap times throughout the race.
• Long-Run Speed: Evaluates tire management by tracking lap time degradation compared to other drivers on similar tire strategies.
• Short-Run Speed: Identifies drivers who maximize fresh tires, measuring their ability to post fast laps immediately after a pit stop.
• Clean Air Speed: Assesses a driver’s pace when running in clean air, unaffected by the aerodynamic turbulence of a car ahead.
• Dirty Air Speed: Evaluates a driver’s ability to maintain speed in traffic, considering the impact of turbulent air on handling.
Restart Rating
Assesses a driver’s performance in gaining or maintaining position after a start or restart.
• Position Change: Number of positions a driver gains or loses immediately after the restart.
• Consistency: Ability to hold running position during the restart.
• Position: Running position where the driver is gaining, losing, or holding position.
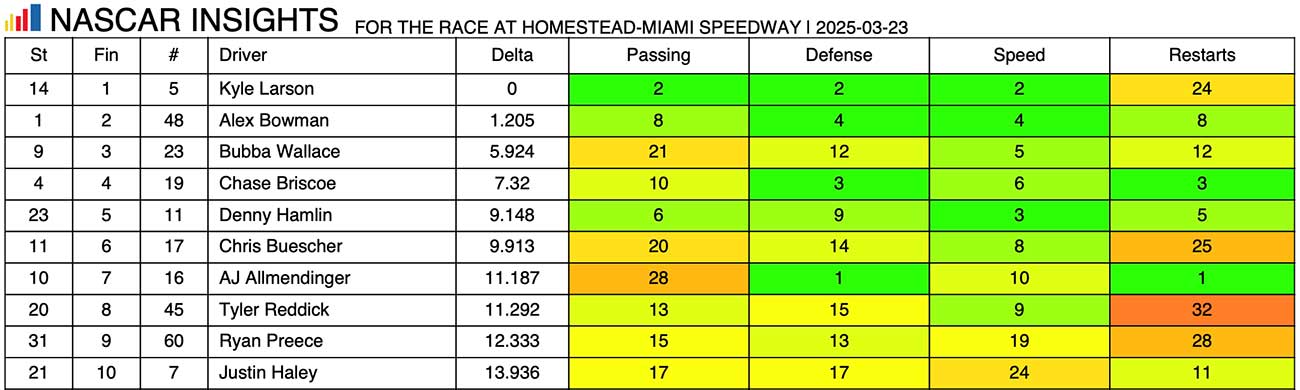
The following chart provides a glimpse at the top 10 finishers from Sunday’s race at Homestead-Miami Speedway, showing where each of those drivers ranked among the 37-car field in the respective four categories.
NASCAR.com plans to incorporate these NASCAR Insights data and analysis into its coverage leading up to and following Sunday’s Cook Out 400 (3 p.m. ET, FS1, MRN and SiriusXM NASCAR Radio) at Martinsville Speedway and for every race remaining on the Cup Series calendar.
Read the full article here


