




I know I can be stubborn. First of all, don’t tell my wife. She already “knows” this, but I’ll never say it out loud (and I still haven’t!). I’ll come up with an idea or learn a theory, see proof of concept one (1) time and latch onto the notion. Anyway, second, I’d like to believe it’s part of human nature.
You couldn’t change my mind about the Bengals outlook in 2021. Joe Burrow’s shortened rookie campaign was enough. And they added his best friend and phenom to run alongside Tee Higgins? Just tell me when they schedule the parade in Cincinnati. And yet, each year, we have the same discussions regarding their claim to a postseason slot.
Advertisement
Post-hype sleepers command similar discourse in fantasy circles. They’re players we know have played well or showed enough flashes, but flopped once the collective community took interest. A few hit their low point in 2025. But let’s see if they’re worth a click in drafts this year.
Join or create a Yahoo Fantasy Football league for the 2026 NFL season
Let’s Set Expectations
Much to my own chagrin, let’s expand on my Bengals analogy.
Typically, post-hype sleepers operate on a three-year cycle. The market values them (slightly) below their original ADP. For rookies, we’ve got historical benchmarks on collegiate production and draft capital to guide us. Vets can follow a different arc, but we’ll get to them. In either case, the value, even the slightest edge in results relative to cost, is enough for us to push their draft price ahead the following season.
Advertisement
But that doesn’t always equate to an equal rise in generated points.
Here’s a look at the post-hype sleeper cycle in fantasy football.
(Chris Allen)
I went through the last 10 years of data to isolate post-hype sleepers in fantasy. It was like walking down Memory Lane of my worst decisions. Regardless, a couple of takeaways here.
First, when things went bad for players, they were catastrophic for fantasy managers. The median drop between ADP and end-of-season ranks was 24 spots across all positions. WRs took the brunt of the collapse (average drop of 44.2). Quarterbacks had the mildest decline (14.7). The impact would pull your team out of playoff contention without an in-season roster adjustment. But the larger point lies in the two bars over the “Discount Year.”


Does the post-hype discount pay off in the end?
(Chris Allen)
Even when we find the guys with the (past) talent to outkick their ADP, us being right is only a minor win. In other words, the hype pulls us out a bit too far over our skis. Think about the Malik Nabers’ buildup going on now. If healthy, he’d be a first-round pick after an electric rookie year. Accordingly, you can almost hear his price creep up with every positive piece of news.
Advertisement
But again, our evaluation of his situation (i.e., health) doesn’t mean Nabers will be a WR1 again. And that’s been the case for RBs and TEs, too. However, we’ve been able to make successful bets in the past.


Here’s a look at the hit rate of post-hype sleepers since 2021.
(Chris Allen)
The hit rate on post-hype sleepers for three of the four skill positions sits at about a coin flip. So, despite the potential for a slight loss in value, there’s upside in targeting the guys we think the market has left behind.
Admittedly, RBs have a tougher draw. But in most cases, we can see the outcome before opening kickoff. Only 9.1% of the running backs over 26 years old with post-hype sleeper appeal exceeded their draft cost. On the flip side, this data point gives us a partial framework to dig into this year’s candidates.
Advertisement
Speaking of, let’s kick things off with a passer carrying some uncertainty into 2026.
The Talent Never Left, Just the Health Bar
I’ll be upfront. I have no dog in the “J.J. McCarthy should be QB1” fight. HC Kevin O’Connell made his decision to make Kyler Murray the starter. But at QB16, gamers have to figure out if there’s any juice to squeeze out of the cost. I say, yes.
Now, one pass in a joint preseason practice has as much relevance to the regular season as this article. But we’ve been able to catch glimpses of Murray connecting with his ancillary pass-catchers. He’s also started reinforcing the idea that Justin Jefferson could be back in the WR1 discussion by season’s end. Regardless, Vikings fans (and fantasy managers) are expecting an upgrade from 2025. And based on history, we’re right to demand more from the offense.
Advertisement
-
EPA per Dropback: 0.05 (Murray, career), -0.14 (McCarthy, 2025)
-
Passing Success Rate: 47.2%, 40.4%
Three stats don’t define a QB, but we can start the conversation here. While Murray hasn’t been the most efficient thrower, his ability to avoid catastrophic plays (e.g., sacks, turnovers) puts him ahead of his current competition in Minnesota. And let’s keep in context that the Cardinals’ offensive line was deteriorating to a similar state as the Vikings. Murray was up to a 34.5% pressure rate in 2025. But unlike McCarthy, Murray brings some mobility to the position.
-
2022: 14.2% (rushing rate), 7th (among all QBs, min. 200 dropbacks)
Even during injury-riddled years, Murray’s rushing rate (combination of scrambles and designed runs) has been inside the top 12. Now, he’s piloting an offense with a playcaller who’s historically integrated high-pace, play-action concepts and pre-snap motion (easy buttons for QBs) at or above the league average since joining the Vikings. While quarterback may seem deep once you get into the middle and late rounds, if I’m looking for upside, Murray fits the archetype of a passer that can finish as a QB1 in 2026.
Other Candidate(s): Baker Mayfield
Subscribe to Fantasy Ultra to unlock our Strategy Lab, 150+ page Draft Playbook and more!
Advertisement
Same RB, Better Price
As the previous data indicated, finding post-hype sleeper RBs is harder than it sounds. There are more losses than wins for those hoping they’ll recapture some magic from their rusher’s best season. However, the guys that have done it give us an idea of where to look.


Here’s a look at the RB hit rates for post-hype sleepers.
(Chris Allen)
Unsurprisingly, good runners tend to stay good. Box score scouts will check total yards or cite yards per carry, but context is everything. Per-touch metrics tend to hold steady for RBs even in their down year. Essentially, the production wanes but their talent doesn’t. You might shake your head at the notion, but look at how often coaches (i.e., people with more knowledge of the situation than me) decided to give those same runners the ball.


Here’s a look at the usage profile and baseline vs. bust by year for RB post-hype sleepers.
(Chris Allen)
Again, not a lot of change. Ball carries saw an average drop of 2.6% percentage points across the opportunity stats most conducive to fantasy scoring. Said another way, if teams felt like their preseason evaluation was wrong, they’d fix it! We’d see a timeshare form before the word “committee” left our lips. I can think of one guy for 2026 that fits, but it may be a stretch.
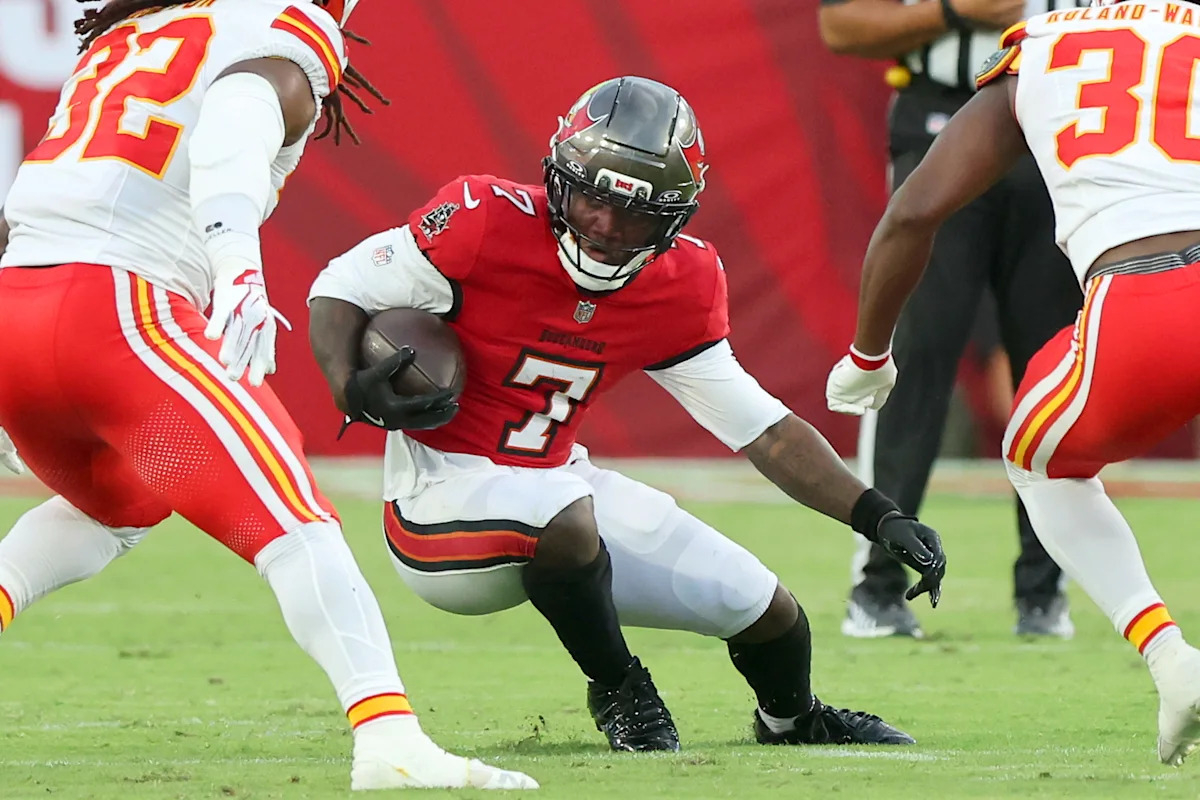
Bucky Irving became everyone’s favorite RB to target in drafts after 2024. The Oregon product dominated the Bucs’ backfield in early-down rushing success rate and forced missed tackles. While also edging out Rachaad White in targets, it became clear who had the juice to take over the following year. But then disaster struck.
Advertisement
-
YAC per Att.: 4.03 (2024), 2.39 (2025, Weeks 1-4)
-
Rushing Success Rate: 50.7%, 33.8%
-
Forced Missed Tackle Rate: 25.6%, 21.1%
Good news, Irving opened the year as the RB1. Bad news: early-season returns were disappointing. He scored two touchdowns in the first month. Despite the boosted workload, it took until Week 4 for us to get a “vintage” Irving performance. However, there are a few hints as to why.
-
Baker Mayfield: sprained MCL, PCL, and bone bruise from Week 2; suffered a bicep contusion in Week 3; AC joint sprain in Week 12.
-
Offensive line injuries: Two starters missed time during the first month; nine different starting rotations used throughout the year.
Irving wasn’t the only Buccaneer dealing with ailments. Again, they’re not the sole explanation for the decline, but a reasonable contributor to most of it. Sure, the addition of Kenneth Gainwell will provide another challenge for Irving as a receiver and short-yardage option. Still, an improvement in offensive situation should be enough to buy into Irving again.
Other Candidate(s): Chuba Hubbard
Advertisement
Buy the Ceiling, Ignore the Substation
Fortunately, the same general logic applies for receivers who we think have a chance to bounce back after a down year. Their volume remains the same, if not better, along with their efficiency. But something outside of their control slashes their productivity. So, when I saw the 49ers prioritize signing a new WR to their corps, I took notice.
Let’s look at Mike Evans’ usage between 2024 and the earlier parts of last season. I know he was injured most of ’25, but we should at least establish the same pattern of a continued high-end workload.
-
Route Rate: 79.1% (2024), 87.1%
-
Target Rate: 25.1%, 29.4%
-
Air Yard Share: 40.3%, 39.0%
For a guy with a couple of young(er) bucks coming after his job, Evans was holding his own. Prior to injury, the 33-year-old was Baker Mayfield’s top option. And Evans put the receptions to good use, leading the team in air yards and first downs per route run. So, on the positive side, he showed he could still compete. But it was still a step down from the year before.
Advertisement
-
First Downs per Route Run: 12.9% (2024), 10.3% (2025, Weeks 1-3)
-
Yards per Route Run: 2.5, 1.4
-
Yards After the Catch per Reception: 2.98, 1.30
Now, I’m not expecting a WR over the age of 30 to still be fleet of foot. That’s where on-field deployment should evolve. But Evans played alongside Emeka Egbuka and Sterling Shepard. Neither of whom could reliably operate as the X-receiver. To make matters worse, as Mayfield picked up injuries, his ability to connect with his main guy plummeted.
-
Completion % (on throws outside the numbers): 59.4% (Mayfield), 73.1% (Purdy)
-
Passing Success Rate: 48.2%, 63.9%
-
EPA per Dropback: 0.12, 0.62
Brock Purdy got the best out of Jauan Jennings, Kendrick Bourne and Demarcus Robinson in similar situations. Now, he gets an albeit older Evans. So, while there is risk of an underwhelming season, Evans’ past profile and current situation have the potential for a hit as a post-hype sleeper.
Advertisement
Other Candidate(s): Xavier Worthy
Not All Cardio for TEs Is Bad
The subtitle is mostly in jest, but the guy I’m going to suggest fits into the bucket of a guy who mostly got his steps in on Sundays instead of scoring points during ’25. Anyway, assuming that a TE who showed the athletic prowess to be effective as a receiver can still do so a few years later is the right place to start.


Here’s a look at the usage profile and baseline to bust by year for tight end post-hype sleepers.
(Chris Allen)
Similar story to the RBs and WRs, the data indicates slight drops in receiving proficiency from TEs who returned to form. Their ecosystems tell the greater story. And I know I mentioned this team earlier, but a change at QB could mean all the difference for T.J. Hockenson.
It bears repeating, but I have no stake in the Vikings’ future. As a Bengals fan, I hope we see y’all in the Super Bowl (and Cincinnati wins). But let’s paint an accurate picture of Hockenson’s last three years.
Advertisement
-
Target Share: 24.0% (2023), 18.1% (2024), 15.9%
-
Yards per Route Run: 1.94, 1.49, 1.12
-
First Downs per Route Run: 9.5%, 10.0%, 5.9%
Hockenson breaks out soon after landing in Minnesota, but tears his ACL in the playoffs. He then missed all of training camp as the team rebuilt around new QB Sam Darnold. Hockenson rejoined the team midstream in their march to the playoffs, displacing ancillary pass-catchers like Jalen Nailor. But the former Lion didn’t have the offseason to refine his timing with Sam Darnold. And let’s rehash the “McCarthy experience” from Hockenson’s point of view.
-
Total Attempts: 37 (McCarthy), 29th (out of 32 QBs)
-
Passing Success Rate (when targeting TEs): 45.9%, 28th
-
EPA per Dropback: 0.14, 21st
So, McCarthy wasn’t throwing that often, nor was he putting Hockenson in situations to win. Meanwhile, Murray ranked second or third in TE target rate for three consecutive seasons. Approximately 34% of his passes went to the TE position from 2023 to 2025. The rest of the league hovered around 23%. If we’re willing to accept that the offense will take a step forward with Murray under center, Hockenson stands to be a beneficiary of the improvement.
Other Candidate(s): David Njoku
Read the full article here


