




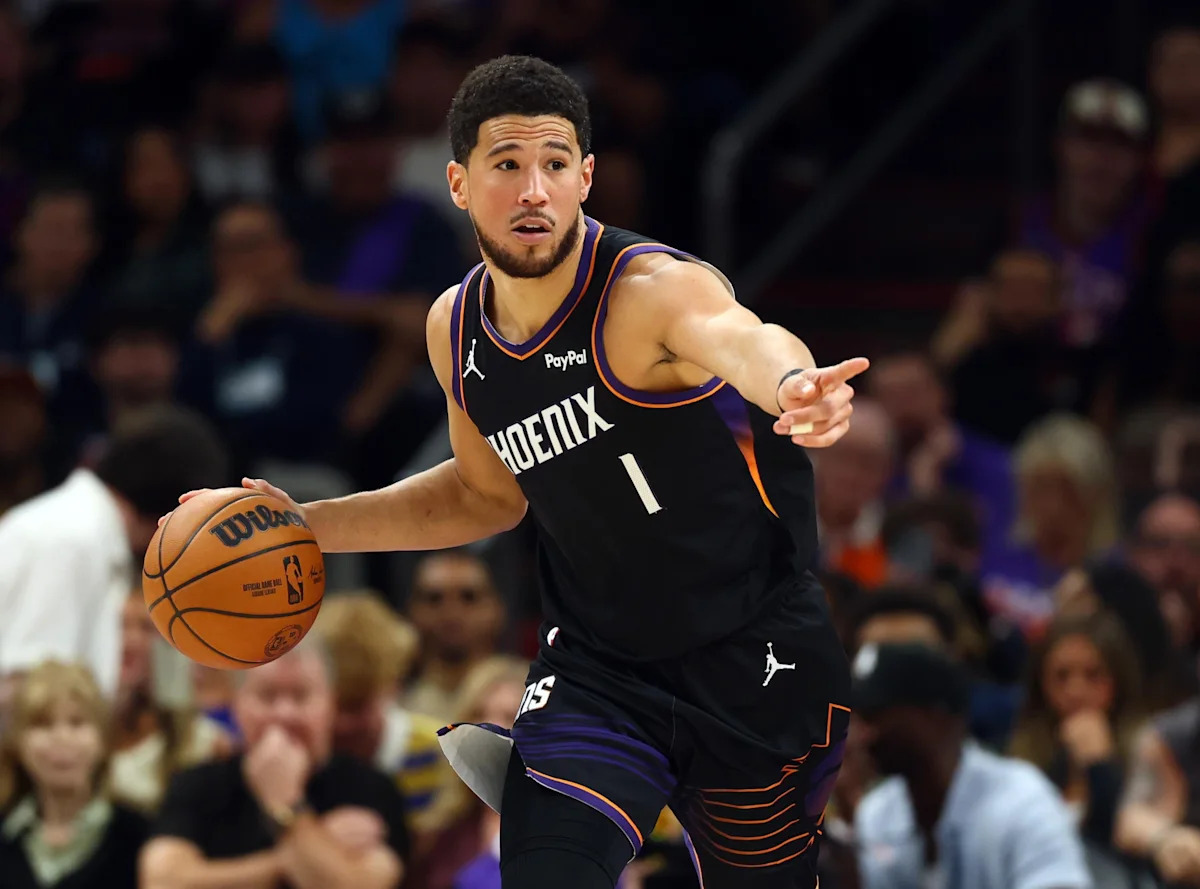
As the offseason prepares to come to a close, with training camp starting in a little over a week, we can’t help but continue trying to project what the 2026–27 Phoenix Suns will ultimately become. There are numerous questions about how the offense will function, what a summer of development has done for the young guys, what adjustments the coaching staff has focused on, and whether they can successfully implement new strategies this season.
Project. That’s about all we can really do at this point. And as I was exploring Basketball-Reference, the holy grail for looking at players throughout NBA history, their statistical output, and the marks they’ve left on the game, I stumbled across something. Basketball-Reference has already put together projections for nearly every player in the NBA this upcoming season.
Advertisement
The only players who don’t have projections are rookies, so in the case of the Phoenix Suns, that means Koa Peat. But if you visit the page of nearly any other member of the roster, you’ll find their statistical projections for the upcoming season.
Have no fear. I went through and collected them all for you so we can take a look at what Basketball-Reference expects of the Suns this season. I do the tedious work so you don’t have to!
There is one important thing to keep in mind before we dive in. All of their projections are on a per-36-minute basis. So take them with a grain of salt.
|
Player |
FG |
FGA |
3P |
3PA |
FT |
FTA |
ORB |
TRB |
AST |
STL |
BLK |
TOV |
PF |
PTS |
FG% |
3P% |
FT% |
|
Collin Gillespie |
5.6 |
13.2 |
3.5 |
8.7 |
1.3 |
1.5 |
1.4 |
5.3 |
5.8 |
1.6 |
0.3 |
1.9 |
2.1 |
16.0 |
0.425 |
0.404 |
0.783 |
|
Devin Booker |
8.8 |
19.1 |
2.2 |
6.5 |
6.5 |
7.4 |
0.9 |
4.2 |
6.5 |
0.9 |
0.3 |
3.1 |
2.8 |
26.3 |
0.459 |
0.333 |
0.878 |
|
Dillon Brooks |
7.2 |
16.7 |
2.6 |
7.3 |
2.6 |
3.2 |
1.0 |
4.3 |
2.1 |
1.1 |
0.2 |
1.7 |
3.8 |
19.7 |
0.431 |
0.361 |
0.715 |
|
Haywood Highsmith |
4 |
8.7 |
1.9 |
4.9 |
1.0 |
1.3 |
1.6 |
5.3 |
2.4 |
1.3 |
0.7 |
1.1 |
3.2 |
10.9 |
0.463 |
0.394 |
0.812 |
|
Jalen Green |
8.5 |
19.6 |
3 |
8.8 |
3.4 |
4.3 |
0.7 |
5.3 |
3.9 |
1.1 |
0.4 |
2.7 |
1.8 |
23.4 |
0.432 |
0.344 |
0.835 |
|
Jamaree Bouyea |
6 |
12.9 |
1.4 |
4.5 |
1.6 |
2.3 |
1.1 |
5 |
4.5 |
1.6 |
0.9 |
1.9 |
2.3 |
15 |
0.461 |
0.308 |
0.833 |
|
Jordan Goodwin |
5.2 |
12.4 |
2.3 |
6.3 |
1.0 |
1.4 |
3 |
7.7 |
3.6 |
2.2 |
0.4 |
1.7 |
3 |
13.7 |
0.416 |
0.367 |
0.554 |
|
Khaman Malauch |
5.5 |
10.4 |
0.9 |
2.9 |
2.2 |
3 |
3.7 |
10.5 |
1.6 |
0.7 |
2.3 |
2.1 |
3.4 |
14.1 |
0.526 |
0.318 |
0.643 |
|
Koby Brea |
6.4 |
14.0 |
3.2 |
8 |
2.1 |
2.6 |
1.3 |
5.6 |
4.2 |
1.0 |
0.5 |
2 |
2.8 |
18.2 |
0.459 |
0.407 |
0.855 |
|
Luke Kennard |
5.1 |
10.1 |
2.6 |
5.8 |
1.4 |
1.6 |
0.8 |
4.2 |
4.2 |
1.2 |
0.2 |
1.5 |
2 |
14.2 |
0.505 |
0.453 |
0.727 |
|
Mark Williams |
7.5 |
12.0 |
0.2 |
0.5 |
3.6 |
4.6 |
4.4 |
12.3 |
2.2 |
1.3 |
1.4 |
1.8 |
3.3 |
18.7 |
0.624 |
0.362 |
0.798 |
|
Miles Bridges |
7.5 |
16.7 |
2.3 |
6.9 |
3.2 |
3.9 |
1.2 |
7.2 |
3.8 |
0.8 |
0.6 |
1.9 |
1.9 |
20.6 |
0.452 |
0.330 |
0.746 |
|
Oso Ighodaro |
4.8 |
7.5 |
0.1 |
0.4 |
1.2 |
2.3 |
2.6 |
8.2 |
3.5 |
1.4 |
1.1 |
1.9 |
4 |
10.8 |
0.63 |
0.345 |
0.513 |
|
Pat Spencer |
5.5 |
13.0 |
1.7 |
4.8 |
1.5 |
1.9 |
1.6 |
5.0 |
6.5 |
1.4 |
0.2 |
2.5 |
2.3 |
14.2 |
0.428 |
0.348 |
0.888 |
|
Rasheer Fleming |
5.1 |
11.8 |
2.4 |
6.6 |
1.4 |
2.2 |
2.8 |
6.8 |
1.5 |
1.2 |
1.1 |
1.6 |
3.3 |
14.0 |
0.431 |
0.359 |
0.747 |
|
Ryan Dunn |
4.9 |
10.7 |
1.7 |
5.3 |
0.7 |
1.3 |
2.5 |
7.6 |
2.4 |
1.4 |
0.9 |
1.4 |
3.6 |
12.2 |
0.454 |
0.332 |
0.77 |
Okay, I’ve taken it with a grain of salt. Now I want something cleaner, something more tangible, and something that gives us a more realistic idea of how Basketball Reference is projecting these players. Knowing a per-36 statistic is fine, but when you take into account only 3 players who played in 10+ games last season and averaged over 36 minutes per game, it’s somewhat of a dead stat.
Advertisement
So I decided to take this exercise one step further. I used the per-36 projections Basketball Reference has for every member of the Phoenix Suns and normalized their statistical output to the minutes each player averaged last season. Ah, math and Excel. I heart you.
I know this is a flawed way to approach it. Minutes and roles will change, and last season’s playing time isn’t necessarily indicative of what each player will receive this year. Still, it gives us a little more insight into the production Basketball-Reference is projecting based on a workload we’ve actually seen these players handle.
|
Player |
MPG |
FG |
FGA |
3P |
3PA |
FT |
FTA |
ORB |
TRB |
AST |
STL |
BLK |
TOV |
PF |
PTS |
FG% |
3P% |
FT% |
|
Collin Gillespie |
28.5 |
4.4 |
10.5 |
2.8 |
6.9 |
1.0 |
1.2 |
1.1 |
4.2 |
4.6 |
1.3 |
0.2 |
1.5 |
1.7 |
12.7 |
0.425 |
0.404 |
0.855 |
|
Devin Booker |
33.5 |
8.2 |
17.8 |
2.0 |
6.0 |
6.0 |
6.9 |
0.8 |
3.9 |
6.0 |
0.8 |
0.3 |
2.9 |
2.6 |
24.5 |
0.459 |
0.333 |
0.878 |
|
Dillon Brooks |
30.4 |
6.1 |
14.1 |
2.2 |
6.2 |
2.2 |
2.7 |
0.8 |
3.6 |
1.8 |
0.9 |
0.2 |
1.4 |
3.2 |
16.6 |
0.431 |
0.361 |
0.833 |
|
Haywood Highsmith |
13.0 |
1.4 |
3.1 |
0.7 |
1.8 |
0.4 |
0.5 |
0.6 |
1.9 |
0.9 |
0.5 |
0.3 |
0.4 |
1.2 |
3.9 |
0.463 |
0.394 |
0.746 |
|
Jalen Green |
25.9 |
6.1 |
14.1 |
2.2 |
6.3 |
2.4 |
3.1 |
0.5 |
3.8 |
2.8 |
0.8 |
0.3 |
1.9 |
1.3 |
16.8 |
0.432 |
0.344 |
0.798 |
|
Jamaree Bouyea |
14.0 |
2.3 |
5.0 |
0.5 |
1.8 |
0.6 |
0.9 |
0.4 |
1.9 |
1.8 |
0.6 |
0.4 |
0.7 |
0.9 |
5.8 |
0.461 |
0.308 |
0.715 |
|
Jordan Goodwin |
22.5 |
3.3 |
7.8 |
1.4 |
3.9 |
0.6 |
0.9 |
1.9 |
4.8 |
2.3 |
1.4 |
0.3 |
1.1 |
1.9 |
8.6 |
0.416 |
0.367 |
0.727 |
|
Khaman Malauch |
8.9 |
1.4 |
2.6 |
0.2 |
0.7 |
0.5 |
0.7 |
0.9 |
2.6 |
0.4 |
0.2 |
0.6 |
0.5 |
0.8 |
3.5 |
0.526 |
0.318 |
0.747 |
|
Koby Brea |
7.0 |
1.2 |
2.7 |
0.6 |
1.6 |
0.4 |
0.5 |
0.3 |
1.1 |
0.8 |
0.2 |
0.1 |
0.4 |
0.5 |
3.5 |
0.459 |
0.407 |
0.812 |
|
Luke Kennard |
21.6 |
3.1 |
6.1 |
1.6 |
3.5 |
0.8 |
1.0 |
0.5 |
2.5 |
2.5 |
0.7 |
0.1 |
0.9 |
1.2 |
8.5 |
0.505 |
0.453 |
0.888 |
|
Mark Williams |
23.6 |
4.9 |
7.9 |
0.1 |
0.3 |
2.4 |
3.0 |
2.9 |
8.1 |
1.4 |
0.9 |
0.9 |
1.2 |
2.2 |
12.3 |
0.624 |
0.362 |
0.783 |
|
Miles Bridges |
31.0 |
6.5 |
14.4 |
2 |
5.9 |
2.8 |
3.4 |
1.0 |
6.2 |
3.3 |
0.7 |
0.5 |
1.6 |
1.6 |
17.7 |
0.452 |
0.330 |
0.835 |
|
Oso Ighodaro |
22.0 |
2.9 |
4.6 |
0.1 |
0.2 |
0.7 |
1.4 |
1.6 |
5.0 |
2.1 |
0.9 |
0.7 |
1.2 |
2.4 |
6.6 |
0.63 |
0.345 |
0.513 |
|
Pat Spencer |
18.6 |
2.8 |
6.7 |
0.9 |
2.5 |
0.8 |
1.0 |
0.8 |
2.6 |
3.4 |
0.7 |
0.1 |
1.3 |
1.2 |
7.3 |
0.428 |
0.348 |
0.77 |
|
Rasheer Fleming |
12.2 |
1.7 |
4.0 |
0.8 |
2.2 |
0.5 |
0.7 |
0.9 |
2.3 |
0.5 |
0.4 |
0.4 |
0.5 |
1.1 |
4.7 |
0.431 |
0.359 |
0.643 |
|
Ryan Dunn |
19.4 |
2.6 |
5.8 |
0.9 |
2.9 |
0.4 |
0.7 |
1.3 |
4.1 |
1.3 |
0.8 |
0.5 |
0.8 |
1.9 |
6.6 |
0.454 |
0.332 |
0.554 |
I know this isn’t a perfect science. Again, these are projections. They never truly are. There are also individual intricacies that get lost in this process. I don’t believe Khaman Maluach will only play 8.9 minutes per game as he did a season ago, nor do I expect Mark Williams to have much impact when he returns from his labrum injury. Still, the exercise gives us an interesting look at how Basketball Reference views the individual players on this roster.
Based on these projections, the Suns would have six players averaging double figures in scoring each night. Overall, the projections have the Suns shooting 47.5% from the field, 36% from beyond the arc, and 75.6% from the free-throw line. And I can fall in love with those three-point shooting numbers from Gillespie and Kennard.
Advertisement
Perhaps the most interesting projection belongs to Devin Booker. Basketball Reference has him averaging 24.5 points per game, which would be his lowest scoring output since his sophomore season back in 2016-17, while matching his assist production from last year. His three-point percentage mildly increases while his free throw attempts drop from 8.1 last season to 6.9 this season. A question we have to ask ourselves is: What does a stat line of 24.5 and 6.0, with 2.9 turnovers, on 46/33/88 splits mean? To us, to him, and to the team?
Another thing I find interesting is the overall shot diet, and it’s something I’m contemplating monitoring throughout the season. Every week during the season, I write a Suns Weekly, which I’m renaming The Solar Report this season as an homage to my podcast’s original name. Within that, I like to find one statistic to mine and monitor throughout the season. This year, the overall shot diet might be one of them.
What does the balance of this offense actually look like? Based on these projections, the Suns would have five different players averaging more than 10 shot attempts per game. That isn’t necessarily unfamiliar territory. We saw a similar distribution last season. What interests me is where those shots are going. Based on my normalized version of Basketball-Reference’s projections, Miles Bridges would be second on the team with 14.4 field goal attempts per game, while Dillon Brooks and Jalen Green would both average 14.1.
Advertisement
Is that the right balance? More importantly, what does balance even look like for this team? That’s something I want to monitor throughout the season. Because with this many players capable of taking double-digit shots on any given night, how those opportunities are distributed could tell us quite a bit about what this offense ultimately becomes.
Again, none of this is gospel. It’s simply another way to look at what this roster could potentially produce. The numbers aren’t telling us what will happen. They’re establishing another baseline for what could happen. Roles will change, minutes will change, injuries and development will blow holes through some of these projections before Thanksgiving. But with training camp around the corner, we’ve officially reached the point where speculation is about to collide with reality. The spreadsheets have had their turn. Now it’s time for basketball to start providing the answers.
Read the full article here


