


The beauty of baseball involves extensive data and advanced stats available for us as fans and fantasy baseball managers. The downside, if we can call it that, involves over 200 players being drafted in most Yahoo leagues, with some deeper formats drafting 450 or more. If you’re like me and love diving into players, it takes time. Instead of digging into every fantasy-relevant player on all teams, we want to take the time to find outliers.
Join or create a Yahoo Fantasy Baseball league for the 2026 MLB season]
Advertisement
Sometimes these outliers can win or lose us weeks (in head-to-head formats) or win or lose us leagues. Breakout players and busts come from situations where the luck factors and skills either aligned in a positive or negative way. One of the biggest questions we ask heading into the following season is whether a player can replicate their success or we should ignore their struggles from the previous year.
We’ll touch on luck factors for hitters and pitchers to keep in mind, plus examine several hitters and pitchers; the goal for the player-level examination is to provide a path for how we might decide whether a player can replicate their success or if we can ignore the struggles from the previous season.
During the season, we should be able to follow a similar path, though the sample might be smaller, which makes the decisions more difficult.
Be Mindful of Hitter Luck Factors
BABIP or Hit Rate
As we mentioned in the introduction to the advanced stats article, we want to examine a player’s data and compare it to their career norms instead of the league average. The same goes for skills, advanced metrics and luck factors. One luck factor is batting average on balls in play (BABIP) or hit rate. Often, we can find hitters have outlier-level (high or low) batting averages related to their high or low BABIP. A player’s BABIP qualifies as a luck factor, meaning there will be variance, but sometimes it isn’t as controllable.
Advertisement
However, we have some hitters who run higher BABIPs because they put the ball in play often, especially with fewer home runs since BABIP removes homers and strikeouts. Speed becomes a factor because faster players may have better batting averages when they put the ball into play. Examples would be José Caballero, Chandler Simpson, Oneil Cruz and Trea Turner, all of whom have high stolen base totals while running higher BABIPs because they’re fast athletes.
Since BABIP doesn’t include home runs, hitters who have higher flyball rates tend to have lower BABIP since flyballs that aren’t home runs tend to be outs. Think about Cal Raleigh, Kyle Schwarber or other elite power hitters who put the ball in the air often; they tend to have lower batting averages and BABIPs. Sure, they could have a higher batting average like Nick Kurtz, but many might be skeptical of a repeat based on the plate discipline and hitter profile.
Home Run to Flyball Rate (HR/F)
Another luck factor is the home run to flyball rate, which is the percentage of home runs per flyball. Like BABIP, check how a hitter fares in HR/F based on their career averages instead of the league norm. If hitters post higher exit velocities, their median projection for HR/F should be around 15-20%. In the near-elite to elite power range, we find hitters post HR/F at 18% or significantly above 20%. However, hitters with a 20% HR/F tend to be the 75th to 90th percentile outcomes.
Advertisement
Often, breakout performances come from players who combine luck and skill. For example, Aaron Judge posted a 30% HR/F over the past four seasons, with over 50 home runs in three out of four seasons. That coincides with Judge’s elite and outlier power metrics. Besides the power skills and exit velocities, the consistent launch angles to hit flyballs matter. Think about some hitters that hit the ball hard, but most often on the ground, like Christian Yelich, Cruz, James Wood and Yandy Díaz. That said, we’ll look at hitters who could see their HR/F rate regress in 2026.
Hitter Skills
The skills for hitters involve plate discipline, power and speed. Plate discipline includes chase, swing, and contact rates. It’s somewhat more difficult to make more contact or improve plate discipline for hitters, though sometimes we find slight variations. That’s notable because hitters can hit the ball hard via bat speed training and strength programs. An example would be Brice Turang, who started hitting the ball harder with better bat speeds, separating himself from the likes of Steven Kwan.
We can typically trust that a hitter can sustain the power skills, especially if they’ve shown it over a decent sample. The idea that it’s unsustainable for a hitter to repeat involves situations where there are mediocre or below-average power skills, yet a hitter’s outcomes (home runs) were higher than expected. Of course, there are instances where the home park factors into the hitter’s outcomes like in Cincinnati, Colorado, Seattle and New York (Yankees). If a hitter typically hit the ball hard, and it fell in a recent season or parts of the season, we could speculate on an injury, assuming it was reported. That’s especially true for back, oblique, lower body, and hand injuries since all components have a key role in swinging hard.
Advertisement
It helps to have hitters who have above-average speed and athleticism when we’re looking at stolen bases. A minor-league track record for stolen bases can give us a slight signal, though the team contexts matter more. It’s probably a bit harder to track which teams tend to run, though we can figure that out via stolen base opportunities. We’ve seen some managers, like Dan Wilson and Dave Martinez, have their players run more often on the base paths, especially with the new stolen base rules in recent seasons. However, it’s not a perfect correlation because the players on the team matter. As we mentioned with injuries, we find hitters stealing less often if there was an injury, especially a lower-body one.
We’ll focus on four hitters who can replicate their previous season or decide whether we should ignore them.
Can These Hitters Replicate the Previous Season or Should We Ignore?
Can Jonathan Aranda Replicate the High Batting Average?
When a hitter like Jonathan Aranda posts a .409 BABIP, we should expect regression. Aranda was fortunate in 2025 from a batting-average standpoint, especially since he hit a ton more line drives after being groundball-heavy. Line drives can be fluky to rely on, though he showed a strong hit tool in the minors and decent plate discipline with a league-average contact rate (77.1%) in 2025. Aranda doesn’t have the speed or athleticism to maintain high BABIPs, so expect Aranda’s to regress in 2026, closer to .250 or .260 like the projections suggest, instead of something over .300.
Here’s a look at Aranda’s 15-game rolling average over the past three seasons.
Will Nick Kurtz Replicate 2025?
There’s no denying Nick Kurtz’s power, given his 77.2 mph bat speed and 72.6% fast swing rate. Kurtz struggles to make contact (64%), yet we would take his .278 xBA since he crushes the ball. When hitters like Kurtz have elite power skills, they can sustain higher home run rates (HR/F). The 90th percentile HR/F for hitters with his type of power was around 25%, so Kurtz lives in the elite range of outcomes. It’s weird to see Kurtz have a high BABIP (.364) given his high flyball (43%) approach. It helps that Kurtz plays his home games in Sutter Health Park again in Sacramento because it tends to boost hitting, with 40 expected home runs in their home park.
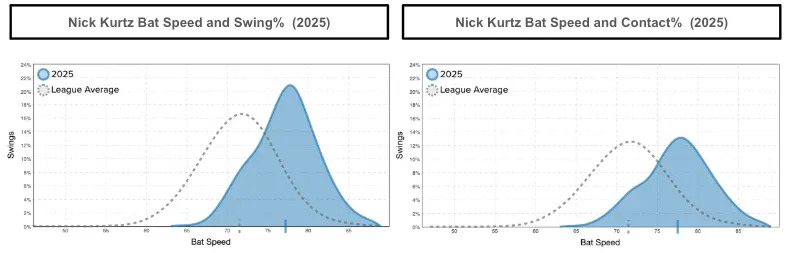
Here’s a look at Nick Kurtz’s bat speed and swing% and his bat speed and contact% from 2025.
We could see his BABIP regress, meaning his batting average will shift somewhere between his xBA and around .260, as the projections suggest. Since Kurtz struggles to make contact, we might expect his batting averages to be below .250. However, it’s worth noting that Kurtz used a patient approach with a 22.2% chase rate, nearly six points below the league average. There was a similar trend with Kurtz’s swing rates, hinting at him being patient and selective.
Advertisement
Kurtz can replicate 2025, though it will come over a large sample of plate appearances, meaning the per-plate appearance data likely won’t sustain. When hitters struggle to make contact, we want them to punish the ball with their bat speed and exit velocities. That’s what Kurtz does. Kurtz’s luck factors should regress slightly, making him a high-risk, high-reward hitter given the skills and price.
Will Oneil Cruz’s Batting Average Bounce Back?
When on the clock, sometimes Oneil Cruz will tease you in the draft after going 21/22 with a .259 BA in 2024, which dipped down to 20/38 and a .200 BA in 2025. Like Kurtz, Cruz struggles to make contact with his massive 6-foot-7 frame. On the surface, Cruz’s luck factors impacted the batting average, evidenced by a .347 BABIP in 2024, down to a .262 BABIP in 2025.
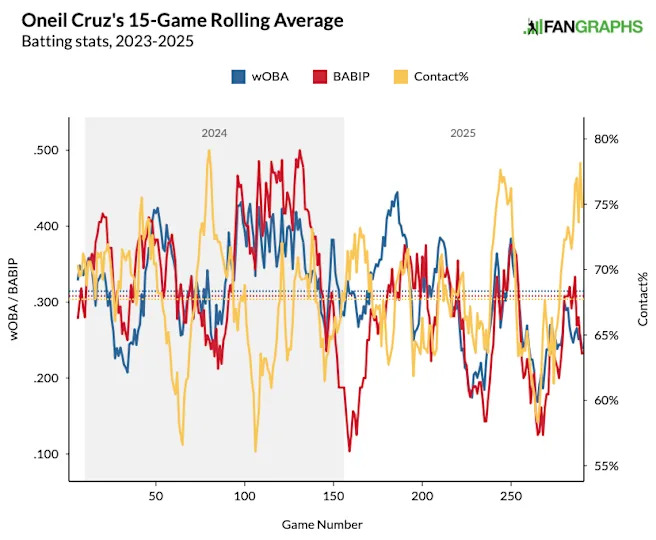
Here’s a look at the Pirates Shortstop’s 15-game rolling average over the past three seasons.
Interestingly, Cruz maintained his contact rates yet seemed to attempt for a more patient approach. That’s evident in Cruz’s chase, swing and zone swing rates dropping by 3-5 percentage points in 2025, compared to 2024. Groundballs have been an issue, with a 47-48% groundball rate. However, Cruz crushes flyballs and line drives when he elevates the ball, ranking third in average exit velocity on flyballs and line drives (EV on FB/LD) at 99.4 mph behind Shohei Ohtani (100.4 mph) and Kyle Schwarber (99.5 mph). That’s nearly 1 mph harder than Cruz’s EV on FB/LD in 2024 (98.5), ranking fifth.
Advertisement
Cruz’s batting average should bounce back since he hits the ball hard while possessing elite speed (93rd percentile) and athleticism. However, Cruz’s batting average might be closer to his career xBA (.233) than his 2025 batting average. For what it’s worth, Cruz is currently hitting a clean 1.000 with two home runs in three at-bats in the World Baseball Classic.
Will George Springer Replicate 2025?
George Springer focused on swinging faster last season, with a 73.7 mph bat speed and a 40.2% fast swing rate. Furthermore, Springer boasted a career-best barrel rate per plate appearance (10.8%), over three percentage points higher than his career norm (7.2%). He went from mediocre power skills from 2022 to 2024 to ballooning to above-average in 2025. We should expect home run regression because Springer’s 32 home runs likely overperformed based on expectations. It’s a matter of regression to what, though, because Springer’s home run projections have been just under 25 home runs for most.

Here’s a look at the Blue Jays OFers barrel/PA percentage by season.
Springer’s home run projection feels like a reasonable outcome, with the stolen bases a sneaky part of his profile. There’s still above-average speed and athleticism for Springer, though he remains efficient with a 94% stolen base conversion rate over the past two seasons with a decent 11-12% stolen base opportunity percentage.
Advertisement
Bake in some home run regression, but 23-25 home runs and 12-15 stolen bases remain a probable outcome to somewhat replicate the 2025 season.
Can These Starting Pitchers Replicate Last Season or Should We Ignore?
There have been mixed thoughts on whether pitchers can control BABIP and hits. Like a hitter’s BABIP, pitchers can be fortunate if they strand runners at a high rate, compared to their career averages. However, high-end pitchers will strand runners because of their strikeout skills. We heard similar conversations about whether pitchers can control the contact quality. However, there’s enough research to show us that pitchers can generate whiffs and weak contact based on the pitch movement profiles and locations.
Generally speaking, pitches with plenty of downward movement should generate more whiffs and ones with more horizontal fade and sweep can elicit weak contact. Skilled pitches can prevent hits and hard contact. Typically, these skilled pitchers elicit swings and misses, making them priority targets in drafts. We’ll examine four pitchers and their stats from 2025 to decide whether they can replicate their previous season or whether we should ignore them.
Advertisement
Can Cade Horton Replicate 8th-Best ERA (2.53)?
Cade Horton posted elite ratios in his rookie season. However, Horton might have one of the bigger gaps between his ERA and xERA, suggesting to be cautious on him replicating his 2025 season. Horton’s skills were mediocre, not mind-blowing, evidenced by a 13% strikeout minus walk rate (K-BB%), 34% ball rate and 11.5% swinging-strike rate. In the minor leagues, we saw Horton post 13-15% swinging strike rates, so there could be more whiffs in the future.
That’s especially true when we consider Horton nearly had two pitches with a 20% swinging-strike rate. Horton’s slider (19%) and changeup (21.5%) led his arsenal from a swinging-strike rate, theoretically helping him against either side of the plate. The sweeping slider possesses above-average downward movement, but the changeup lacks an above-average movement profile.
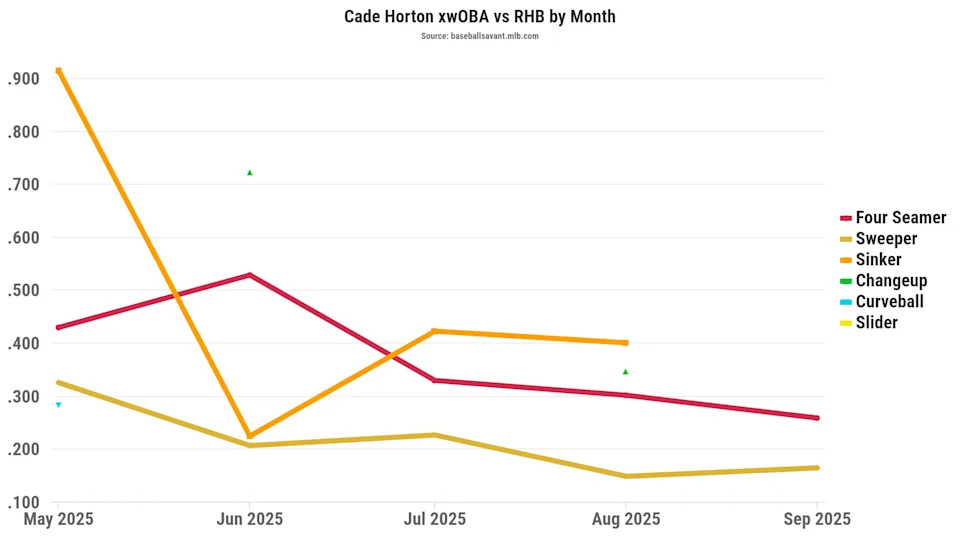
Here’s a look at the Cubs SP’s expected wOBA against right-handed batters by month last season.
Thankfully, Horton’s sweeper (.209 wOBA, .219 xwOBA) performed well against right-handed hitters, with the four-seam allowing a wOBA under .300 (.255), yet a .374 xwOBA. Besides the sweeper and four-seamer, no other pitches fared well with a wOBA under .300 against right-handed hitters. We saw similar outcomes against left-handed hitters, with his changeup allowing a .163 wOBA (.237 xwOBA) and the curveball giving up a .231 wOBA (.233 xwOBA).
Advertisement
The data points to being cautious on Horton replicating his rookie season.
Will Yoshinobu Yamamoto provide ace-like outcomes again?
After shoulder injuries in 2024, Yoshinobu Yamamoto pitched like an ace, with a 2.49 ERA, 0.99 WHIP, 20% K-BB% and a 13% swinging-strike rate across 173 innings. He continued that dominance into the playoffs, throwing an additional 37 innings, with a 1.45 ERA, 0.78 WHIP, 18.8% K-BB% and a 3.05 Skill Interactive ERA (SIERA). There have been some with concerns about Yamamoto’s workload of over 200 innings when combining the regular and postseason, especially since many of the Dodgers’ starting pitchers have injury concerns.
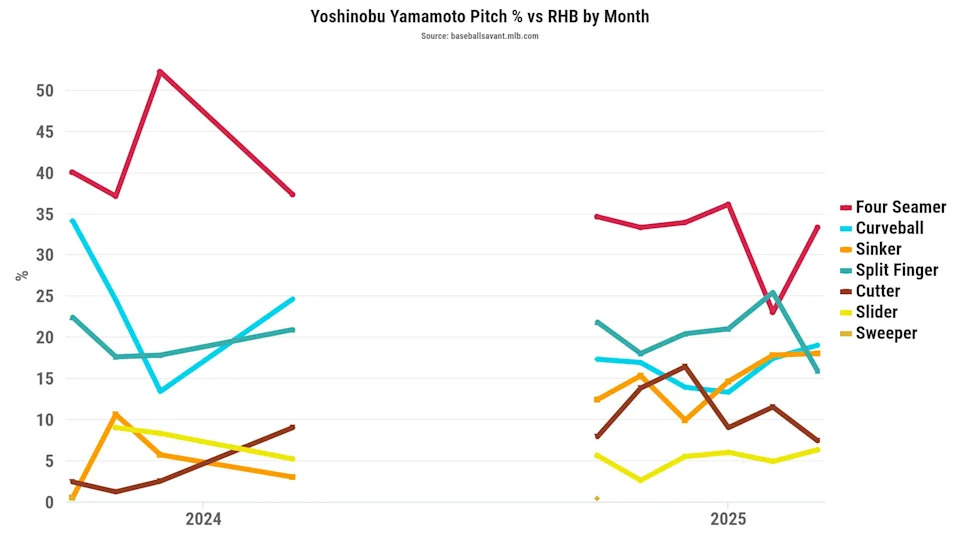
Here’s a look at the Dodgers SP’s pitch percentage against right-handed batters by month over the past two seasons.
Yamamoto’s 3.04 xERA suggests some regression, but the skills point toward a near-elite starting pitcher. He maintained his pitch mix against left-handed hitters, but made a slight adjustment to right-handed hitters by lowering his four-seam usage by nearly 10 percentage points (32.1%). That coincided with Yamamoto throwing more sinkers (14.5%) and cutters (11.1%) against right-handed hitters in 2025. Both the sinker and cutter were thrown 8-9 percentage points higher in 2025 against righties.
_by_month.jpeg)
Here’s a look at Yamamoto’s average release point for horizontal movement by month the past two seasons.
Although Yamamoto’s cutter (.315 wOBA, .382 xwOBA) and sinker (.361 wOBA, .364 xwOBA) weren’t dominant offerings, it seemed to add depth to his arsenal, giving him a diversified attack against right-handed hitters. He also threw from a lower arm angle (43 degrees) down three points from 2024, primarily because his horizontal release point shifted nearly eight inches (7.7) farther away from his midline in 2025. That potentially was a more comfortable arm slot for Yamamoto, and didn’t impact his pitch movement profiles significantly besides the curveball adding nearly two inches of downward movement.
Advertisement
The projection systems expect a slight dip in volume, around 155-160 innings. After digging deeper into Yamamoto, his skills and team context make him worth the high draft price in the late second round. There’s a good chance he replicates most of his 2025 season.
Should We Ignore Andrew Abbott’s Success?
Like Horton, Andrew Abbott outperformed his expected metrics. Abbott posted a 2.87 ERA with a 4.37 xERA. That’s scary because Abbott pitches in one of the most hitter-friendly home parks in Cincinnati. Abbott posted average skills, evidenced by a 15% K-BB%, 33% ball rate and an 11.4% swinging-strike rate. He was fortunate because he was stranding runners 80% of the time while limiting home runs (8%), though he allowed a 47-48% flyball rate. The rolling Statcast park factors has the Great American Ball Park as the second-best in home run park factor behind Dodger Stadium.
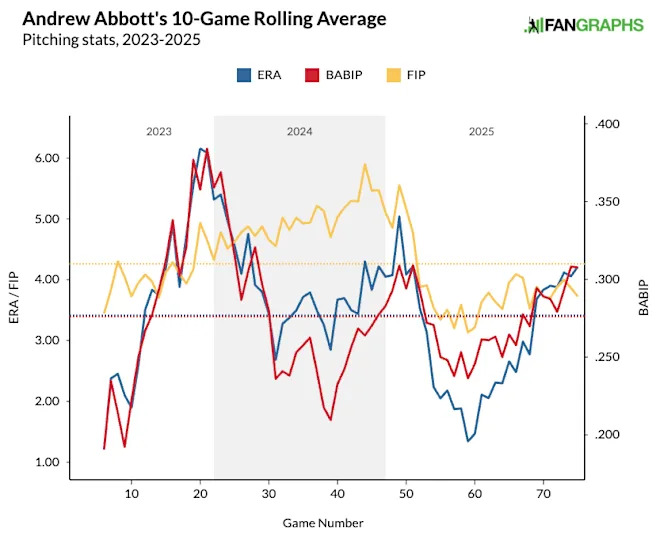
Here’s a look at the Reds SP’s 10-game rolling averages for ERA, BABIP and FIP the past three seasons.
There’s a good chance Abbott might give up more home runs, especially since there’s a small margin for error when pitchers like him rely on their command. Abbott averaged a 104 Location+, with all five pitches having a Location+ at 103 or higher, aligning with the command we see in the heatmaps. The slider is the only pitch with an above-average swinging-strike rate (18.4%), with his changeup (12.9%) and cutter (13.9%) being the other two offerings missing bats at a double-digit rate.
Advertisement
Be cautious with Abbott, though 2024 might be a more reasonable outcome (3.72 ERA, 1.15 WHIP) while giving up more home runs. Abbott’s draft cost bakes in the regression, so we don’t need to overcount it for 2026. We shouldn’t ignore the success because Abbott profiles as a command-over-stuff starting pitcher.
Should or Shouldn’t We Ignore Shane Baz’s Rough Patch in 2025?
Shane Baz was recovering from Tommy John surgery in 2024 and pitched well with a 3.06 ERA and 1.06 WHIP across 79 innings. There was optimism for Baz heading into 2025, but the outcomes didn’t align with expectations. Baz threw 166 innings, with awful results (4.87 ERA, 1.33 WHIP), yet Baz’s 3.84 xERA suggests poor luck. That’s notable because Baz’s skills sustained from 2024 into 2025, evidenced by a 34% ball rate and 12% swinging-strike rate.

Here’s a look at Baz’s 10-game rolling averages for ERA, HR/FB and Swinging Strike% over the past two seasons.
Besides Baz’s BABIP and strand rate regression in an unfavorable way, he gave up more home runs, with a 15% HR/F in 2025, up from 9% in 2024. It’s worth noting that Baz played in George Steinbrenner Field in 2025, which ranked sixth in home run park factor, tying them with the Athletics’ home park. Baz pitched in a hitter-friendly home park in 2025, which looks similar in 2026 while playing in Camden Yards (5th-best home run park factor).
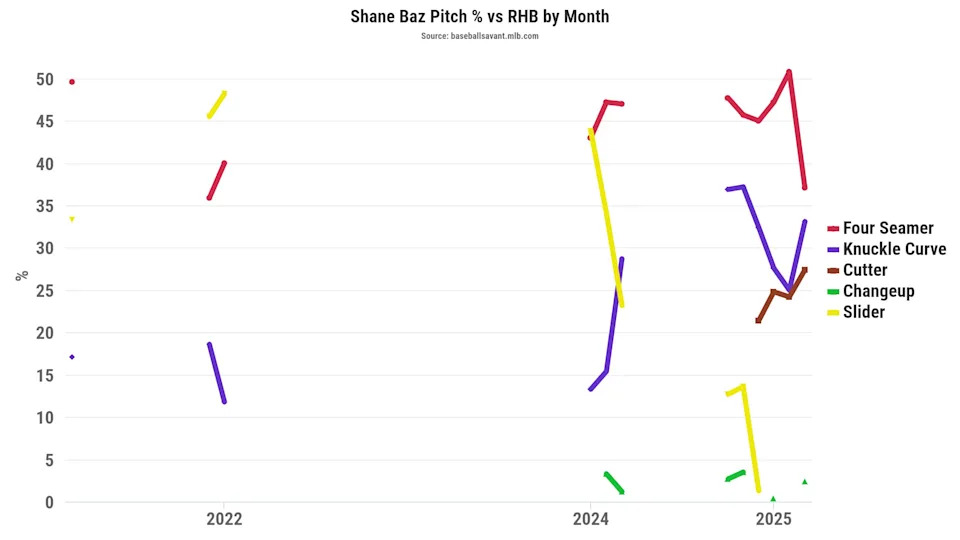
Here’s a look at Baz’s pitch percentage vs. right-handed batters by month from the past three seasons.
Baz added a cutter in 2025, which looked like a harder version of his slider with gyro-slide movement. For context, Baz’s cutter had very little horizontal movement, yet lost 10 inches of downward movement (25.6 inches) compared to the slider (35.6 inches). Baz’s cutter hasn’t been dominant against right-handed hitters, allowing a .325 wOBA (.283 xwOBA) in 2025 as his third-most used pitch (14.3%) behind the four-seam (46.3%) and knuckle curve (32.3%).
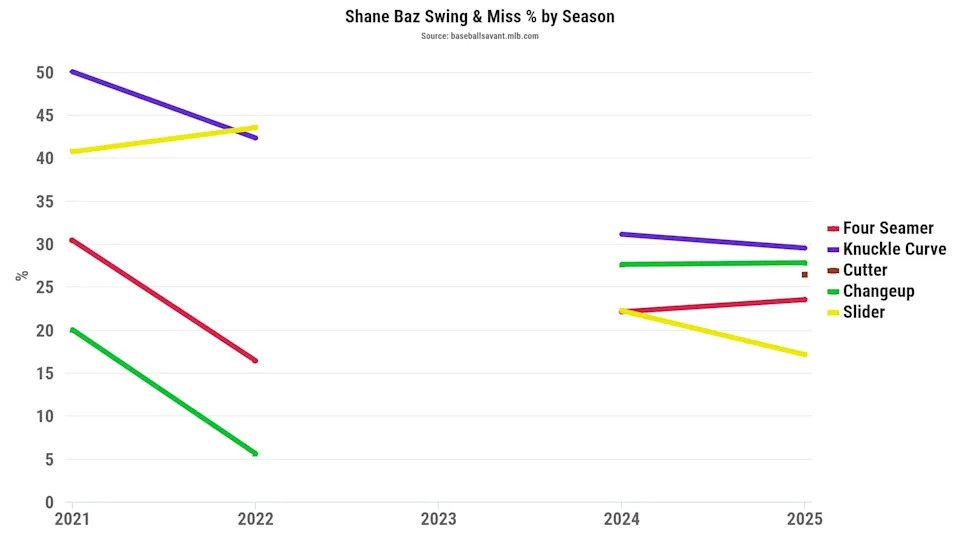
Here’s a look at Baz’s swing and miss percentage since 2021.
Baz’s slider used to be his best pitch for whiffs with a 21-23% swinging-strike rate in 2021 and 2022. However, those were smaller samples and Baz made adjustments to the arsenal after recovering from Tommy John surgery in 2024. Baz tends to have some reverse splits, with poorer results against right-handed hitters than left-handed hitters. That’s evident in his knuckle curve being the primary quality offering against righties (.268 wOBA, .270 xwOBA). However, Baz has multiple quality pitches against left-handed hitters, including the changeup (.270 wOBA, .245 xwOBA) and knuckle curve (.255 wOBA, .214 xwOBA).
Advertisement
Baz will be a stuff (107 Stuff+) over command (98 Location+) starting pitcher. That suggests we should chase pitchers like Baz, as a low-risk, high-upside option. Don’t ignore Baz in drafts based on the poor results from 2025.
Read the full article here